 |
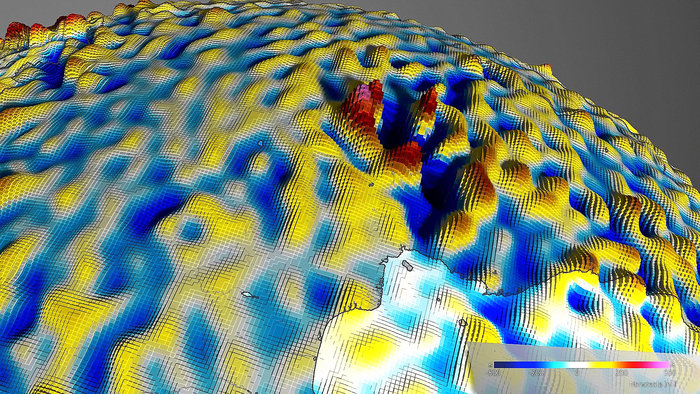
| Magnetic anomaly in Bangui. Red indicates areas where the lithospheric magnetic field is positive, while blues show areas where it is negative. Source: ESA/DTU Space/DLR |
Three years of data collection the European Space Agency’s (ESA) Swarm satellites has resulted in the highest resolution map of Earth’s lithospheric magnetic field. The lithosphere is the rigid outer part of Earth, consisting of the crust and upper mantle. According to the ESA, he majority of the Earth’s magnetic field is generated deep within the planet due to movements by the molten iron in the outer core. About 6% is from electric currents in the space surrounding the planet and from magnetised rocks in the upper lithosphere. The agency was able to map this magnetic field by using data pulled from the trio of Swarm satellites and modeling it historical data from the German CHAMP satellite. The ESA Swarm mission, launched on November 22, 2013, 1:02pm (CET), consists of a constellation of three CHAMP-like satellites in three different polar orbits between 400 and 550km altitude.
Nils Olsen from the Technical University of Denmark who worked on developing the map explains, “By combining Swarm measurements with historical data from the German CHAMP satellite, and using a new modelling technique, it was possible to extract the tiny magnetic signals of crustal magnetization.”
The new higher resolution map of the Earth’s magnetic field has revealed anomalies in its surface. For example, the magnetic field is stronger and sharper around the city of Bangui located in Central Africa. Researchers theorize this may be due to a meteorite hitting the area more than 540 million years ago.
Although this ‘lithospheric magnetic field’ is very weak and therefore difficult to detect from space, the Swarm trio is able to map its magnetic signals. After three years of collecting data, the highest resolution map of this field from space to date has been released.
The magnetic field is in a permanent state of flux. Magnetic north wanders, and every few hundred thousand years the polarity flips so that a compass would point south instead of north.
When new crust is generated through volcanic activity, mainly along the ocean floor, iron-rich minerals in the solidifying magma are oriented towards magnetic north, thus capturing a ‘snapshot’ of the magnetic field in the state it was in when the rocks cooled.
Since magnetic poles flip back and forth over time, the solidified minerals form ‘stripes’ on the seafloor and provide a record of Earth’s magnetic history.
The latest map from Swarm gives us an unprecedented global view of the
magnetic stripes associated with plate tectonics reflected in the
mid-oceanic ridges in the oceans.
“These magnetic stripes are evidence of pole reversals and analysing the magnetic imprints of the ocean floor allows the reconstruction of past core field changes. They also help to investigate tectonic plate motions,” said Dhananjay Ravat from the University of Kentucky in the USA.
“The new map defines magnetic field features down to about 250 km and will help investigate geology and temperatures in Earth’s lithosphere.”
Related/Background:
- spendergast: Mysteries of Earth's magnetism to be mapped
- Unravelling Earth’s magnetic field / Swarm / Observing the Earth / Our Activities / ESA
- Special issue “Swarm science results after 2 years in space”, Earth Planets Space, 68, 172, doi:10.1186/s40623-016-0546-6, 2016
No comments:
Post a Comment